Signal Monitor: Commercial Intelligence for the Events Sector
An automated monitoring pipeline that replaces hours of manual industry tracking with a structured five-minute weekly brief. Built for the UK exhibitions and events sector, it monitors over thirty companies across RSS, websites, LinkedIn, careers boards, and regulatory feeds, extracts commercially relevant signals with AI classification, and every Friday morning emails the finished brief, with a branded A4 report attached, to distribution lists the client manages himself. He runs the whole thing from a web portal: which companies are watched, who receives the report, an archive of every issue, and a dry preview of any company before it goes live.
- Problem
- A commercial director tracking thirty-odd competitors by hand and forwarding what he found to his own clients. Coverage drifted; weeks got missed.
- What changed
- Every Friday a pipeline reads six source types per company, a language model extracts and classifies the signals, and a branded brief lands in his clients’ inboxes as email and PDF. He manages the watchlist and the recipient lists himself.
- Result
- Several hours of weekly checking became minutes of pipeline time and a five-minute read. No week missed since; my involvement in a normal week is zero.
- How it ran
- Started as a proof of concept posting to a Discord channel, tested by the client from the first week, and grown in phases as each version showed the next gap.
The Problem
In the UK exhibitions sector, the moves that matter tend to happen quietly. A competitor picks up a niche organiser. A new commercial director arrives from a rival. A venue operator announces a show format that overlaps with yours. None of this lands in a single place, and by the time it surfaces in a general news feed, the window for responding has often passed.
Fragmented sources
Relevant signals appear across company newsrooms, industry publications such as Exhibition News, RSS feeds from trade bodies, LinkedIn posts by senior executives, and events calendars. There is no single feed or database that aggregates this at a useful level of specificity.
High noise, low signal
Even when a team subscribes to all the relevant feeds, the volume of content is significant. Most of it is irrelevant: event recaps, generic marketing copy, sponsor announcements, procedural updates. Extracting the material from the noise is itself a time-consuming task.
Manual tracking does not scale
A researcher tracking thirty companies across four or five source types per company is dealing with 120 to 150 distinct data points per week. Keeping that up, every week, without gaps, is not a realistic expectation of any individual. Coverage drifts. Sources get missed. Signals arrive late or not at all.
Time sensitivity
Signals like a new hire, a confirmed acquisition, or a market entry announcement have a short window of relevance. Intelligence that arrives late, or is buried in an unsorted inbox, has diminished value.
The Solution
The goal was to take humans out of the loop between source and report. That meant building ingestion, classification, and delivery as a single automated pipeline with no manual steps between them.
Automated weekly monitoring
The pipeline runs on a fixed schedule, Friday morning London time, covering all target companies in a single pass, with no manual intervention required.
Multi-source aggregation
For each company, the system pulls from multiple source types: RSS feeds, company websites, LinkedIn posts via search APIs, events-specific content, careers boards, and regulatory announcement feeds for listed entities. Industry news sources are treated as global feeds and scanned for company mentions.
AI-powered signal classification
A two-stage language model pipeline handles extraction and reporting. Stage 1 identifies and categorises signals using strict criteria. Stage 2 synthesises the output into a structured weekly brief.
Branded delivery
The finished brief goes out by email to recipient lists the client manages, one send per list with recipients in bcc, so no client ever sees another's address. A Soltech-styled A4 report rides along as an attachment, every issue is archived in the web app, and operational summaries and source-health alerts still post to Discord.
Self-serve administration
The system started as a report the client read; it is now a product he operates. From the portal he adds or pauses watched companies, previews what a new company would yield before the next run, manages which of his clients receive the weekly email, and browses the full archive. No config files, no asking me.
Architecture
The system is structured as a sequential pipeline with clearly separated concerns: fetch, classify, deduplicate, report.
- Checksum FilteringContent is checksummed on ingestion; unchanged content is skipped, avoiding redundant processing and unnecessary token usage
- Stage 1: Signal ExtractionStructured prompt extracts signals with category, confidence, summary, commercial significance, evidence, and named entities · Low-confidence signals discarded early · A 14-day freshness gate is applied in code, not by the model
- Entity-Level DeduplicationSignals matched on company, category, primary entity, and time bucket; multi-source announcements collapse to a single signal · 12-week rolling persistence
- Stage 2: Report GenerationStructured signals transformed into a formatted, category-based weekly brief · Synthesis and formatting only, not classification
- Output LayerEmail delivery per recipient list via Resend · Issue archive in the web app · PDF generation via ReportLab · Operational logging and source health alerts to Discord
Signal categories
Stage 1 classifies against predefined categories to ensure consistency across runs: executive appointments, mergers and acquisitions, product launches, and expansion activity. Signals that do not meet confidence thresholds are discarded before persistence.
Scheduling and operation
The pipeline runs every Friday at 08:30 London time under its own launchd agent on the production host. The watchlist lives in SQLite alongside the portal's own state (lists, issues, deliveries, a change log); the pipeline's working memory (seen signals, source checksums, failure counts) stays in JSON files it owns. Both sides read the same watchlist, so a company added in the portal on Tuesday is fetched on Friday with nothing redeployed. A dry-run mode and a 205-test suite cover the pipeline and the web app.
AI Integration
Language models are used selectively, only where deterministic approaches break down. The signals targeted do not follow predictable linguistic patterns and require contextual judgement; a rules-based classifier would be brittle and expensive to maintain.
Stage 1: Signal extraction
The extraction layer is designed for high selectivity. The prompt enforces strict criteria: signals must be recent, commercially relevant, and actionable. Low-confidence outputs are discarded before persistence. Global industry news sources are processed with company attribution logic, allowing a single feed to contribute signals across multiple monitored organisations.
Stage 2: Report generation
Stage 2 operates on structured data, not raw content. It performs formatting and synthesis only, presenting signals coherently within the weekly brief format, not making classification decisions. This separation keeps each stage’s responsibility narrow and its output predictable.
What the model is not asked to do
Anything a rule can decide, a rule decides. The 14-day freshness gate runs in code after extraction. Careers boards are filtered for seniority before a posting ever reaches the prompt, so a junior vacancy costs no tokens. Deduplication is a fingerprint, not a judgement call. The model's job is narrowed to the one thing it is good at: reading a press release and saying what, if anything, just happened.
The Portal
For its first five months Signal Monitor was a script that posted to Discord and a YAML file only I could edit. Adding a company meant a message to me. That is fine for a proof of concept and wrong for something a commercial director wants to put in front of his own clients. The portal is what turned it from my tool into his.
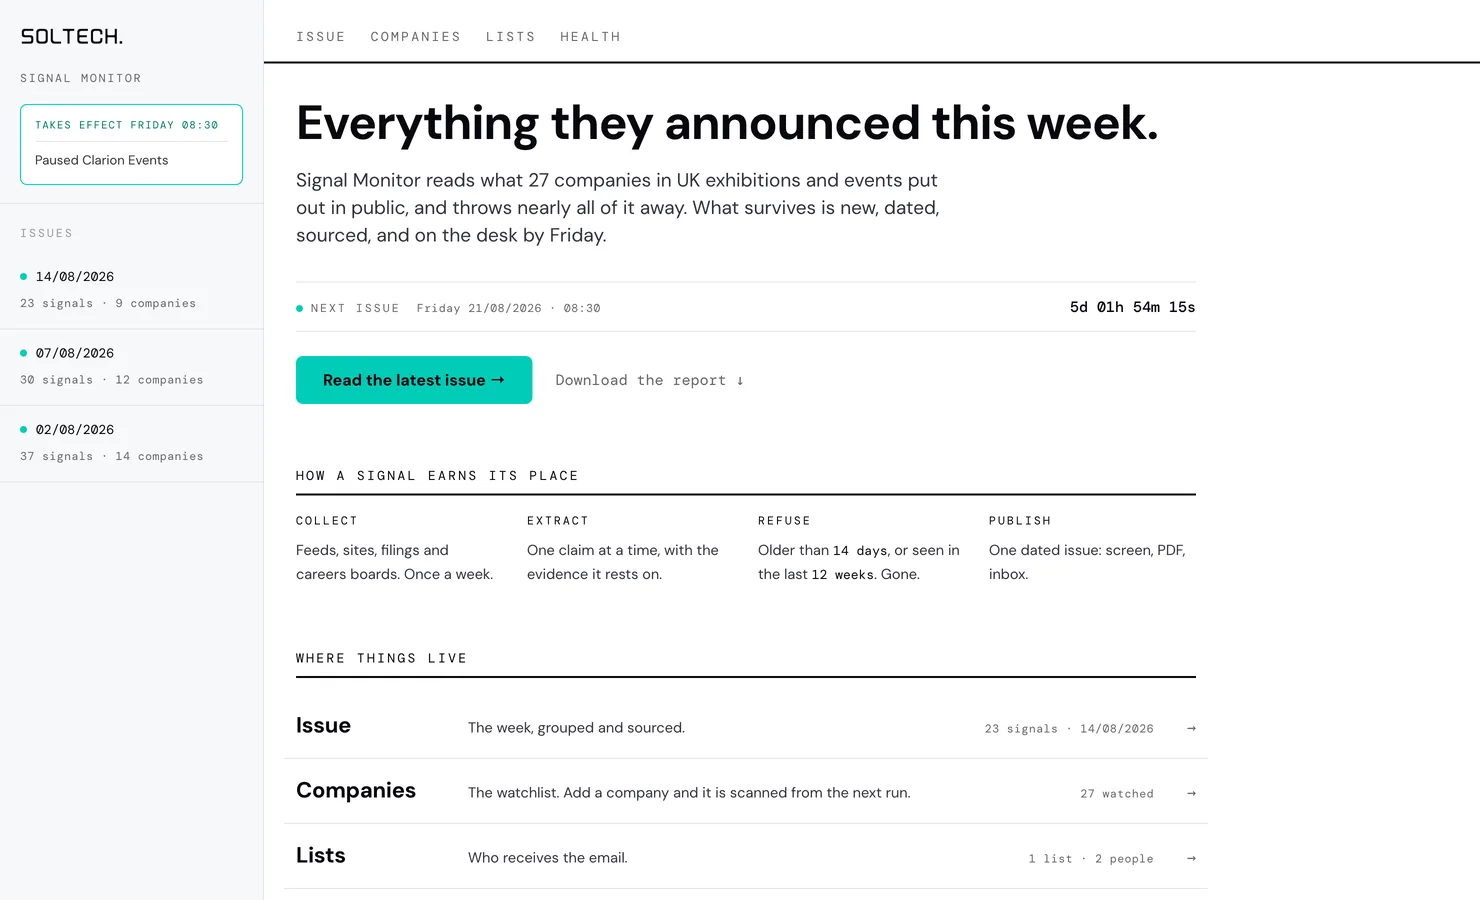
It is deliberately boring engineering: FastAPI serving server-rendered Jinja templates with HTMX for the interactive bits. No JavaScript build step, no Node on the production host. It runs on the same machine as the pipeline, binds to localhost only, and reaches the internet through a Cloudflare Tunnel with Cloudflare Access as the identity gate. Access blocks unauthenticated requests at the edge; the app verifies the signed assertion again at the origin and refuses to start at all if the Access configuration is missing, so a misconfigured tunnel is a closed door rather than an open one. It is styled in the same design system as this website, light theme only, no icon library, mono uppercase labels doing the wayfinding.
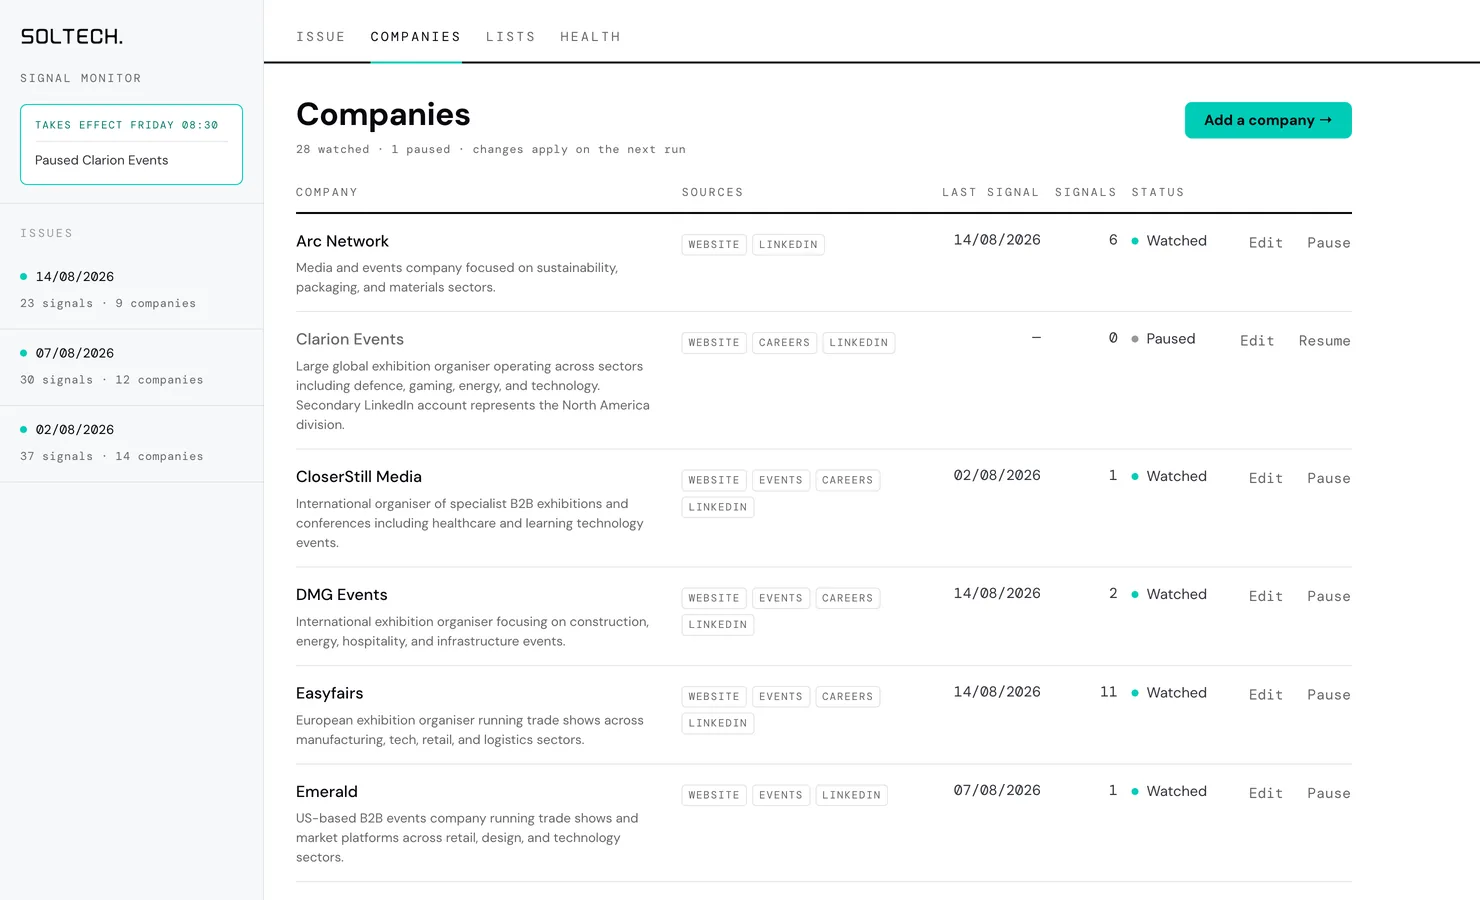
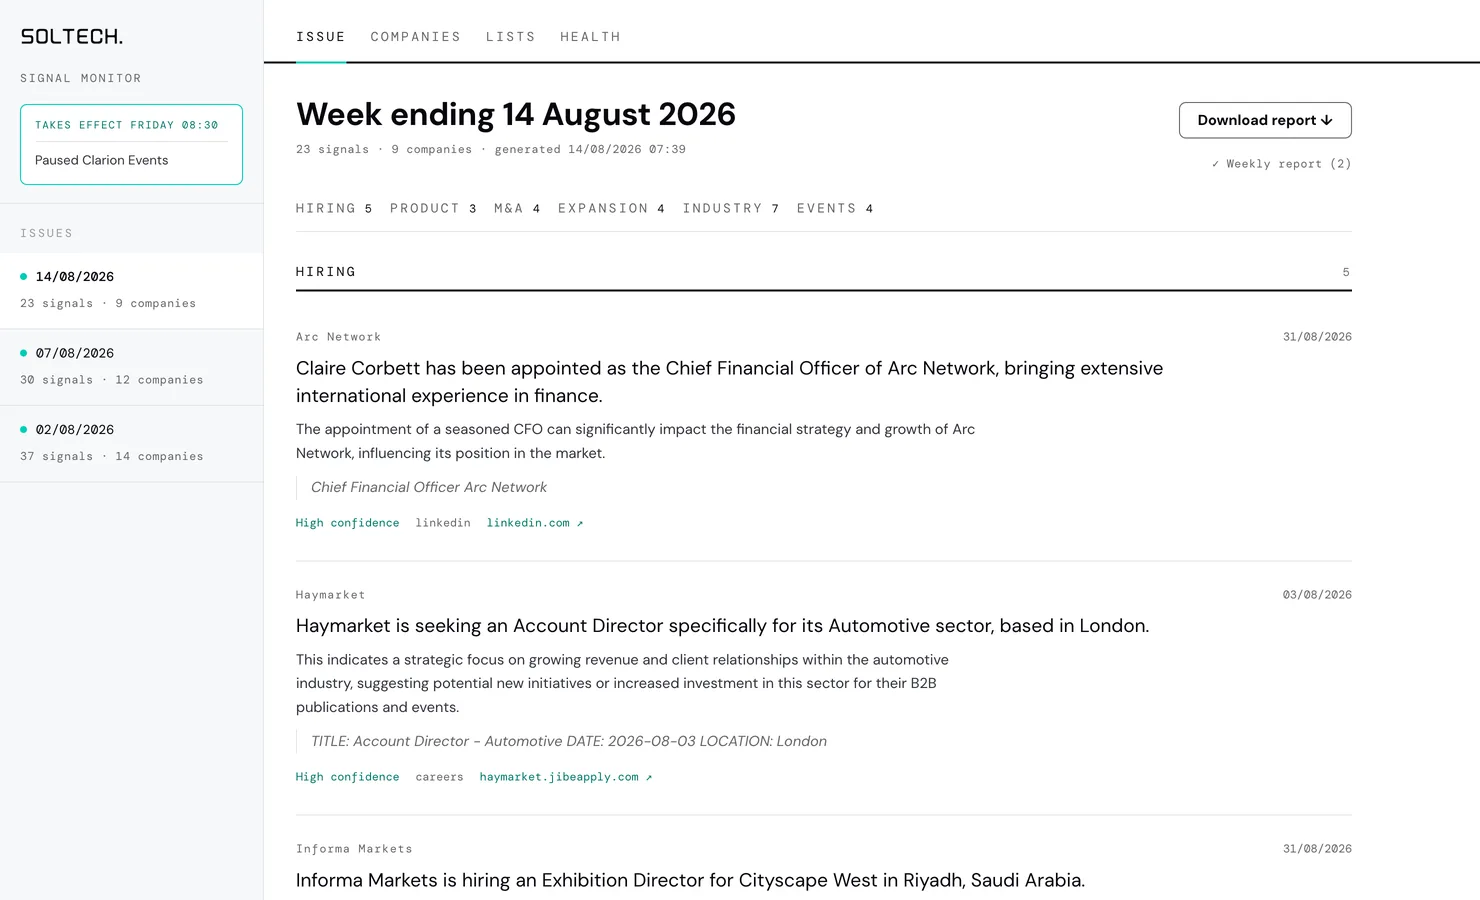
Companies carry their sources as chips and can be paused without being deleted. Recipient lists are either internal or client; client lists receive the same brief with no link back to the tool, so what lands in a client inbox is a finished report, not an invitation to log in somewhere. Any list can be sent the latest issue on demand. Each archived issue shows its signals grouped by category with jump links, the events diary, a download button for the PDF, and a receipt for every list it was delivered to. A Health page shows the last twelve runs and any source that has failed three weeks running.
The Report
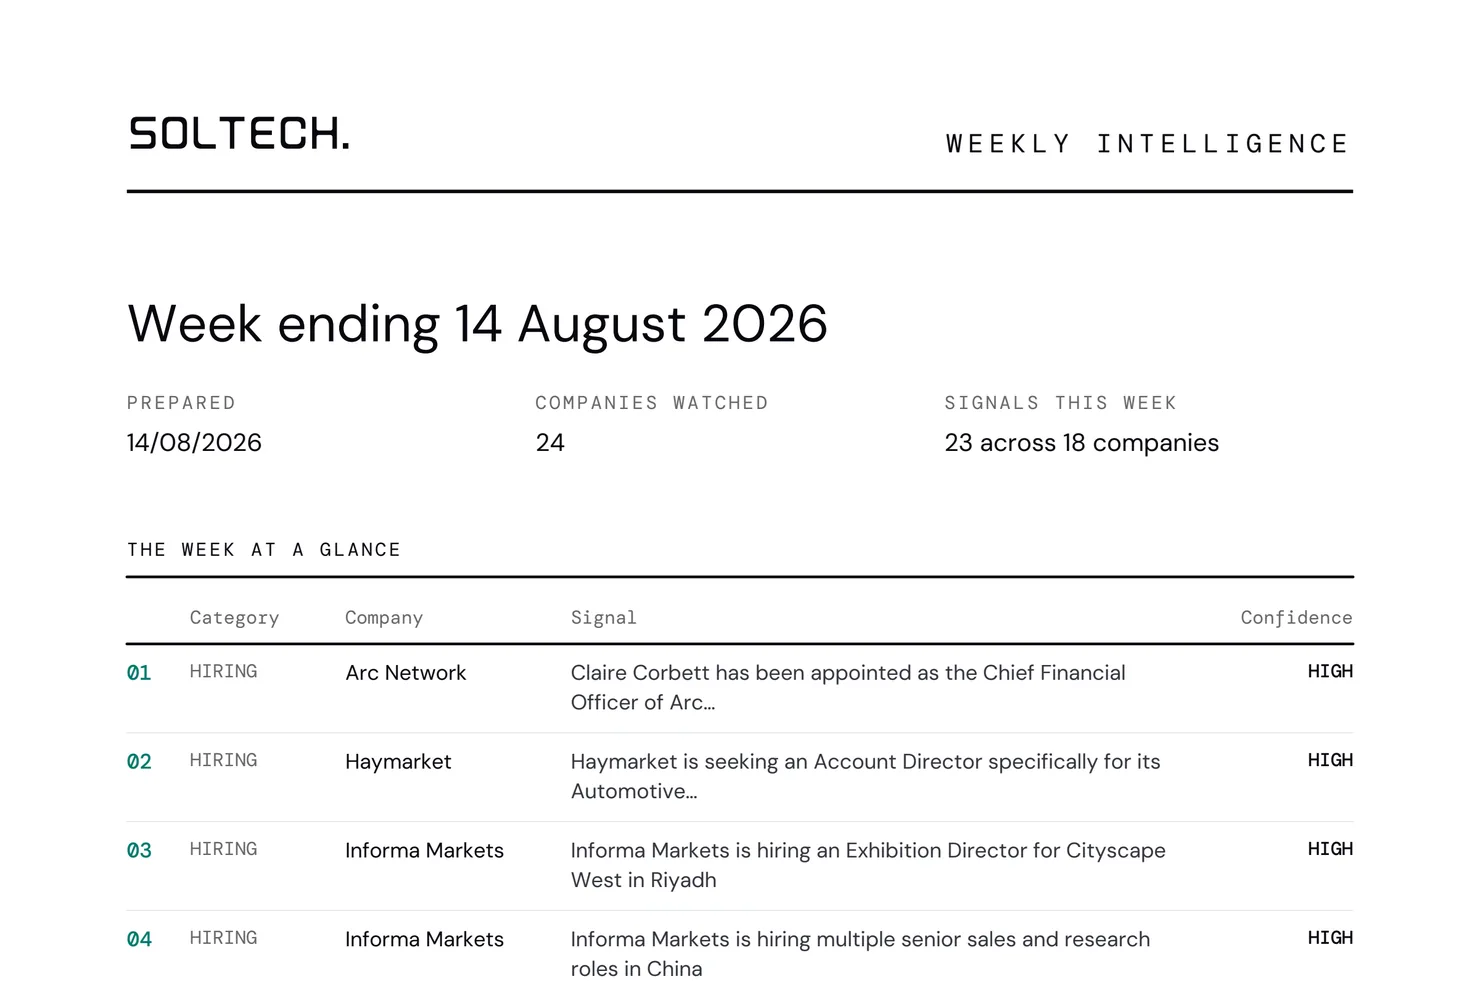
The thing Giles's clients actually see is the PDF, and until August it was a default ReportLab document that looked like a script wrote it. It was rebuilt in the Soltech design system: DM Sans and DM Mono embedded, the wordmark drawn from its SVG paths rather than typed, one teal accent on the numbering spine, and the confidence level carried in ink weight instead of colour. Page one is the whole week at a glance, one ruled line per signal in confidence order, so a reader can decide in thirty seconds whether page two is worth their time.
The email that carries it is a 640px table with every style inline, because that is what survives Outlook. The wordmark travels as an inline attachment rather than an SVG or data URI, for the same reason. Above eighteen signals only the high-confidence ones get inline detail and the rest defer to the PDF, which keeps the message under Gmail's clipping limit. The subject line carries the count, so a week with nothing to report says so before it is opened.
The Journey
The current architecture did not arrive fully formed. Each phase fixed a failure mode in what came before.
- Phase 1Manual monitoringManual review of company websites and trade publications. Output depended on who had time that week, which meant inconsistent cadence and gaps in coverage.
- Phase 2Feed aggregationRSS feeds and newsletters cut the navigation overhead. But the volume of content grew faster than the ability to filter it: more to read, not more to act on.
- Phase 3Web scrapingScraping extended coverage beyond what feeds provided. Page structure varies, access constraints are real, and getting stable extraction working took iteration. Ingestion eventually settled.
- Phase 4AI classificationAI classification moved the bottleneck. Human review became the exception, only needed when the model flagged low-confidence signals or a source went dark. Coverage across all thirty companies became consistent for the first time.
- Phase 5Accuracy and efficiency refinementsEntity-level deduplication collapsed multi-source announcements into single signals. Checksum-based filtering meant unchanged content skipped processing entirely, cutting token usage and run time.
- Phase 6From report to productDelivery moved from a Discord channel to email with a redesigned PDF, and administration moved from YAML files on the host to a web portal behind Cloudflare Access. The client now controls coverage and distribution himself; the maintainer's involvement in a normal week is zero.
Challenges and Trade-offs
| Challenge | Approach |
|---|---|
| Signal precision versus coverage. Aggressive extraction increases recall but reduces reliability. | System prioritises high-confidence signals, accepting that some lower-confidence content is excluded. Precision over recall. |
| Source reliability. Feeds and websites change unpredictably, creating silent coverage gaps. | Failure tracking surfaces gaps early: a summary posts to a dedicated Discord channel after each run, and the portal's Health page lists any source that has failed three weeks running. |
| LinkedIn constraints. Direct API access is heavily restricted. | Indirect retrieval through a chain of search providers (Serper, Brave, SerpAPI) with a scrape fallback, accepting a dependency on third-party indexing latency. |
| LLM cost versus quality. Higher-capability models improve extraction but increase operating cost. | Multi-provider fallback chain balances cost and output quality, with providers selected based on performance and reliability per task type. |
| Batch scheduling. Weekly cadence limits recovery from a failed run to the next scheduled execution. | Weekly execution simplifies operation and monitoring. The trade-off is accepted: the value window for most signals spans days, not hours. |
Impact
Signal Monitor runs in production for Momentum Works. Each Friday morning, the pipeline processes over thirty companies across six source types and emails a structured intelligence brief to the client's distribution lists with no human involved between source pull and delivery.
What previously took several hours of manual checking takes the pipeline minutes. The brief itself takes under five minutes to read. Teams doing this work by hand were not keeping up with thirty companies at any consistent frequency; now coverage runs every week without gaps.
The rolling deduplication store means the same announcement does not appear twice across consecutive weeks. Archived reports are available for audit. When a source fails, it surfaces in a dedicated Discord channel the same morning, not discovered retroactively when someone notices a company went quiet.
The shift that matters most is who operates it: intelligence that used to be forwarded by hand out of Discord now lands directly in his clients' inboxes, from lists he controls.
Christophe built a signals monitoring tool for Momentum Works that helped change how my client prioritised key accounts. We needed a way to track public domain signals across a set group of companies without spending any time on manual research. After carefully listening to how I and my client actually work he built something specific rather than something generic and had a working version in front of me quickly enough to test properly. He also built it in such a way that he was able to add features and customisation into the solution. If you need someone who understands the commercial problem before writing any code Christophe is definitely worth talking to.
Future Enhancements
- Event-to-CRM integration Extending the events capture pipeline to push structured event data into a CRM via API, enabling agencies to automatically track upcoming shows, align outreach with event timelines, and embed market activity directly into commercial workflows.
- Historical trend analysis. Extending the signal store to support time-series insights across companies and categories.
- Entity resolution. Normalising entity references across signals to improve cross-source aggregation accuracy.
- Alert prioritisation. Introducing urgency tiers to surface high-impact signals (such as M&A activity) above the standard weekly cadence.
- Feedback loops. Capturing user feedback to refine extraction quality and signal taxonomy over time.
- Additional sources. Expanding ingestion to include podcasts, press syndication feeds, and investor relations content.
Tech Stack
Need a system like this?
The underlying approach, pulling from fragmented sources, classifying for commercial relevance, and delivering on a fixed schedule, applies well beyond the events sector. Any market with enough public signal and not enough time to watch it is a candidate.
If you are tracking competitors manually, or have a market you cannot follow closely enough, get in touch.